Search This Blog

Thursday, January 16, 2014

Model portfolio up 51% annualized, 62% since initiation


Happy new year everyone! 2014 is here, with new opportunities and new challenges.

We are entering into the new year with a booming economy in the Unites States and Japan, with Europe slowly reemerging from recession, and China tagging along its new trend growth (e.g. around 7% p.a.).

The picture is mixed in other BRICs countries, with India experiencing slower growth as a result of bad government policies, and Brazil suffering from higher US interest rates. Though higher, interest rates are still record low in a historic context, making no doubts about the role of credit financed investment once again becoming the key driver of growth.

Before making bold predictions about future investment opportunities, it makes sense to reconcile past predictions. There is no better place to start than with past expectations that resulted in money being placed, underlining the conviction behind the predictions made. Hence, I start the first blog of the new year with a review of the Model Portfolio.

The Model Portfolio is up 62% since November 2012. As it was initiated only a bit more than a year ago, annualized returns to date are 51%.

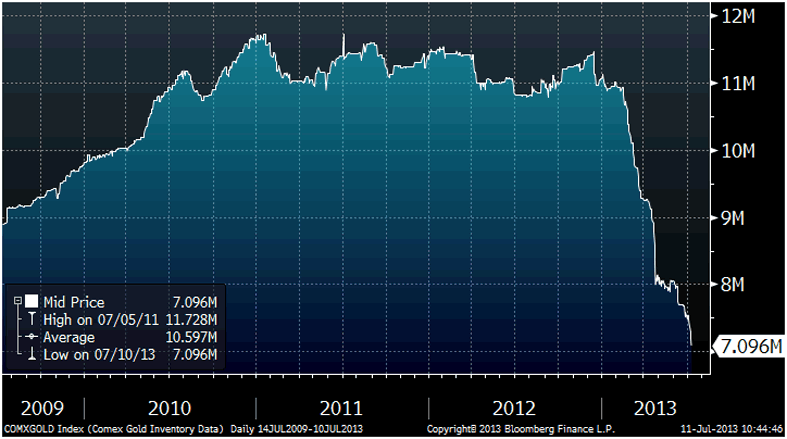
Portfolio assets were selected with the objective to minimize the risk of overall market fluctuations ("systemic risk") and only take specific positions in assets with opposite reactions to the same underlying macroeconomic driver (e.g. negative correlation). In order words, the portfolio was designed to do well independently of whether the overall stock market went up or down. A long position is Google was balanced against a short position in Apple. And a long position in Bank of America was partially off-set with a long position in gold (US recovery is positive for BAC, but negative for gold).

Common to all positions was a belief in increased liquidity in financial markets, eventually driving global inflation. As the first step in an inflationary cycle is asset inflation, the expectation has been met by surging asset values in nearly all global markets, across nearly all asset classes (commodities still being the general exception).

In spite of massive monetary stimuli by all major global central banks, inflation has still not reached Consumer Price Indexes, and has therefore still not reached the point of distorting prices, thus leading to economic inefficiencies.

Several reasons have been offered for why this has not happened yet. Behavioural economist have been pointing out that the debt loving baby boomer generation has been retiring in the US, with younger generations having a more prudent view on debt financed spending. Others have pointed out that the credit worthiness of millions of Americans has been impaired during the financial crisis, thus making them less able to borrow.

I think the explanation is much much simpler than that. In my view, there is one factor alone that overwhelmingly explains why inflation today is not double digit: The capital reserve requirement for banks has increased dramatically in the aftermath of the financial crisis.

In 2008, average banking Tier 1 capital requirements were only about 4-5% of total assets. As this implied banks could lend 20 dollars for each dollar of reserves, every new dollar created by the central bank implied 20 new dollars in circulation. Today, average banking Tier 1 reserve ratios are above 15%. That means every new dollar created is only equivalent to less than 7 new dollars in circulation.

If banks had gone from 5% to 15% capital reserve requirements without the central bank increasing the money supply, simple math suggests the affected economies would have experienced a deflation of nearly 70% (equivalent to the reduction in credit and money in circulation). Interestingly, the increase in the monetary base has been very near this figure. So central banks have been able to pull through the miracle of financing increased government spending with new money without causing inflation.

A second relevant, more intermediate factor, is that since price increases are caused by more money in circulation chasing the same amount of resources, inflation will not materialize as long as there is surplus supply of a resource at the given price level.

In the market for labour, this is illustrated by the Phillips Curve (see a previous post), which simply states that inflation will not materialize as long as unemployment is above a certain level. Philips called this the "equilibrium unemployment rate". Below this level, for the US recently estimated to be around 6%, competition for labour will push up wages, creating more demand from consumers, driving up general prices.

Hence, for inflation to materialize, the global economy must first face an economic boom, were unemployment first reaches record lows. Then wages will increase. Unless interest rates then rise to slow the economy down, wage increases will continue to drive increased demand, re-inforcing the boom, eventually causing commodity prices to increase, causing inflation to escalate.

Since the debt levels today are still very high in the economy, the central bank is likely not to raise interest rates before inflation has run its course for several years. If too high inflation goes on for too long, it will cause allocation of resources to unproductive sectors of the economy, making the recession extremely painful once the central bank eventually decides to apply the brakes (like Paul Volcker did in 1981). An extreme case of a recession following a period of high inflation also  happened in Germany in the 1930s, eventually creating a political sentiment supportive of Adolf Hitler coming to power.

OK, now this post is becoming much longer than I had intended. So let me get to what the expectations are for the Model Portfolio.

I am convinced that we are now in the very early phases of what will eventually become an inflationary boom. The reasons for this is that capital requirements of banks are unlikely to increase further, so the sterilizing impact this has had on money in circulation is unlikely to continue. Meanwhile, the FEB, ECB, BoJ, Bank of China, all of them have continued issuing new money at almost the same speed.

This should continue to lift the Model Portfolio higher, with the exception that gold will only start moving AFTER the other positions have flattened out their surge.

With unemployment in the US currently at 6.7%, it is likely to reach below 6% sometime during the second quarter of 2014. Inflation should materialize in paralell around that time, but will not escalate to problematic levels until unemployment goes down to around 5%.

When that happens (most likely in q3 or q4 of 2014), gold will be back in play. Meanwhile, there will be investment opportunities in markets that are still undergoing asset deflation (e.g. Spain, Greece, Italy). Stabilization of these economies imply they will be de-risked, and wage levels once again will become competitive, as the rest of the world will experience inflation.

Happy investing 2014!


Thursday, August 29, 2013

Portfolio update

The model portfolio has shown some retreat from peaking at 40% returns in May.


The retreat is mainly due to Apple shares surging, reducing gains on the AAPL short position. BAC has been gaining, whilst GOOG has been showing some signs of retreat. The AAPL short position still provides a good hedge for the GOOG long position, though further declines in AAPL are likely to experience less momentum as the entire stock market is held up by quantitative easing.

I would expect September to see a reversal of the AAPL price move (perhaps down to around $450), with a continued surge in gold. GOOG and BAC are likely to remain flat or slightly decline as long term interest rates continue their climb, increasing the discount factor used by financial analysts.

Monday, July 15, 2013

Is the price of gold manipulated?


It is highly possible. In a paper market where no physical delivery is required, one can simultaneously buy and sell gold. E.g. if I am a large bank or a hedge fund (or the United States government, as certain gold bulls seem believe) and I want to keep the price down, I open two (or more) accounts and I trade between these at times when the market is highly illiquid (e.g. when I can easily sell to myself without interference).

This type of manipulation is often seen attempted in the stock market, where it it has to be done repeatedly to drive the price movement for a stock (for this reason, stock exchanges are monitoring the counter-parties for trades using sophisticated algorithms, so don’t try this at home…). In the market for gold, it only needs to be done from time to time, as stop-losses and margin calls on leveraged positions will escalate a downward (or upward) move.

However, it is key to note that it only works when the market is illiquid (you need fill your buy order simultaneously with your sell order in order to avoid losses). This may explain why the recent sell off in gold was initiated with a large sell order placed in the middle of the night when market liquidity was at its lowest (the worst possible timing for a profit maximizing seller), triggering the first leg down in the gold decline to $1321/ oz in April this year.

Nevertheless, unless the manipulation in the paper market is successful in amending the price expectations players of the physical market, it is doomed to be short-lived. The corresponding dynamic will be that demand for physical gold will explode (and yes, we have certainly seen that happening), eventually creating a gap between those contracts that allow for physical delivery and those that don’t.

I tend to believe that the April price move was not government manipulation, but rather a large hedge fund (most likely Goldman Sachs) who had figured out where most of the stops in the market were, and saw the opportunity to profit from a short-position by pushing the market lower. It has subsequently succeeded in scaring the lights out of retail investors, who are liquidating their ETF holdings, and changing the American and European market sentiment for gold.

At least for now.

Price of gold manipulated?
It is highly possible. In a paper market where no physical delivery is required, one can simultaneously buy and sell gold. E.g. if I am the government (or a large bank or a hedge fund) and I want to keep the price down, I open two (or more) accounts and I trade between these at times when the market is highly illiquid (e.g. when I can easily sell to myself without interference).
This type of manipulation is often seen attempted in the stock market, where it it has to be done repeatedly to drive the price movement for a stock (for this reason, stock exchanges are monitoring the counter-parties for trades using sophisticated algorithms, so don’t try this at home…). In the market for gold, it only needs to be done from time to time, as stop-losses and margin calls on leveraged positions will escalate a downward (or upward) move.
However, it is key to note that it only works when the market is illiquid (you need fill your buy order simultaneously with your sell order in order to avoid losses). This may explain why the recent sell off in gold was initiated with a large sell order placed at the point in time when market liquidity was at its lowest (the worst possible timing for a profit maximizing seller), triggering the first leg down in the gold decline to $1321/ oz in May this year.
Nevertheless, unless the manipulation in the paper market is successful in amending the price expectations players of the physical market, it is doomed to be short-lived. The corresponding dynamic will be that demand for physical gold will explode (and yes, we have certainly seen that happening), eventually creating a gap between those contracts that allow for physical delivery and those that don’t.
I tend to believe that the April price move was not government manipulation, but rather a large hedge fund (most likely close to Goldman Sachs) who had figured out where most of the stops in the market were, and saw the opportunity to profit from a short-position by pushing the market lower. It has subsequently succeeded in scaring the lights out of retail investors, who are liquidating their ETF holdings, and changing the American and European market sentiment for gold.
At least for now.
- See more at: http://www.visualcapitalist.com/what-is-the-cost-of-mining-gold#comment-15533

Sunday, July 14, 2013

Doubling down on Gold? Sell-offs are about to reside.

Gold is currently trading at $1280 per ounce. The price has been pushed down after continued sell-offs by Exchange Traded Funds.

The key question is, has the gold price reached a bottom, or is it close to forming a bottom?

As shown by the below table (courtesy of the World Gold Council), the only ones who have been net sellers in q1 2013 (the key players in driving the gold price down) are the aforementioned ETFs.


With industrial demand stable and all other sources of demand increasing, the key question then becomes, can the ETF sell-off continue?

The below chart is showing the inventory of gold in COMEX vaults, which is where many professional investors store their gold (courtesy of Bloomberg finance).


As seen from the chart, inventory reduction since December 2012 corresponds to 4.5 million ounces, or close to 140 tonnes of gold. Though this is slightly less than half of total ETF sales since December, it gives a good indication of how much gold stock there is left to supply to the market.

As the chart only provides data until end of May 2013 (and we've had another month of net sell-offs), current inventory levels are likely to be around 6-6.5 million ounces, e.g. they are at the same levels as they were in 2004.

This has several implications:
  1. A sell-off of the same magnitude in the next 6 months becomes impossible, as this will take ETF inventory levels to 0. 
  2. A continued sell-off must therefore occur at lower volumes. It is therefore highly unlikely that prices will come much further down, as the market has been able to absorb the massive volumes supplied by the ETFs, with only modest price declines (yes, in my book, a 30% decline for a commodity with this magnitude of sell-offs of is modest)
  3. There is huge upside in gold once the sell-off is completed. As ETFs are momentum buyers (the public is always displaying herd mentality and are following the trend), they will return to gold once the prices stop dropping. It is key to note, that the market was clearing around the $1700/oz level before the ETF sell-off started.

As mentioned in a previous article, the gold price is not mainly determined by the sentiment of the American public, at least not in the long run. It is driven by wage inflation in Asia and other economies where people either do not trust the local banking system (India) or want to store their wealth in assets that are hidden from the eyes of the local authorities (China). Nevertheless, ETFs provide the residual demand and supply that gives the gold price extra volatility. American inflation is therefore not a requirement to support the gold price, but is the trigger that will reignite price momentum once it takes place.

Sunday, June 30, 2013

Dollar collapse....finally?

The key dynamics of the most recent global macroeconomic paradigm (e.g. the last 40 years) can be summarized in a few points:

1. In 1971 the US dollar was taken off the gold standard, enabling America to issue unlimited quantities of new currency at will. The United States has been running a deficit on its balance of trade since then, accumulating debt to foreigners. In 40 years, the dollar has not once depreciated enough to allow for the trade-balance to turn into a surplus.

2. The early 1970s was also when China followed Japan, Taiwan, Hong Kong and others in adopting an economic growth strategy based on exports, mainly to the United States. The main component of the strategy was having their central banks matching cash flows from the exports of goods with purchases of financial assets in the United States (e.g. government bonds) to avoid their currencies from appreciating (which would hurt the exports).

3. The impact on the US and Asian economies of the above policy choices has been two-fold:

(i) Asian central banks placing their dollars balances drove the 30 year bull-run in the market for government bonds, pushed yields below levels needed for the preservation of the purchasing power of money invested, helped creating the US asset bubble in housing, as well as pushed up US stock market valuations. Currently, total financial assets held by foreigners amount to more than 9 trillion dollars, nearly 2/3rds of all government debt and almost 60% of US GDP.

(ii) Avoiding appreciating domestic currencies required the Asian central banks to issue new currency to pay for the dollars that were bought. As the proceeds from exports went to domestic producers who redeployed it in the economy, the policy resulted in increasing the domestic monetary supply, creating significant inflation and massive credit expansion in Japan in the 1980s (leading to the largest asset bubble the world has ever seen), and massive inflation and credit expansion in China in the last decade (and another huge asset bubble, the full consequences are yet to be seen). 

Now, all that's in the past. How much longer can the current paradigm be extended, e.g. what about the future?

It is highly relevant to note that the two economies that have played the largest role in supporting the value of the dollar for the past 40 years currently are in the process of experiencing dramatic economic reversals, which are directly related to the long-term consequences of their past policy choices.

After a decade of deflation, Japan has recently resorted to a policy of hyper-aggressive monetary and fiscal expansion ("Abenomics"), aimed at stimulating the public to spend and invest as their cash holdings will yield negative returns when inflation increases. This policy has sent the currency down 20% vs the dollar, boosted consumer spending (+3.5%) and stock market valuations (up 55% for the year).

China's domestic inflation problems have eroded the competitiveness of Chinese producers, as dollar denominated wages have doubled between 2008 and 2013 to currently averaging around $8000 p.a., nearly 20% above wage levels in for example Mexico. Simultaneously, the shadow banking system, which has managed the majority of Chinese savings, is collapsing due to falling real estate valuations, implying China is going from rapid credit expansion to rapid credit contraction. Money is being pulled out of the shadow banking system and invested into gold and other assets that still allow an escape from the tax man, a major factor contributing to China becoming the largest buyer of gold globally in the first quarter of 2013.

In other words, Japan has already stopped supporting the dollar. With its domestic sector collapsing, China is becoming even more dependent on exports for growth, and is likely to continue with asset purchases in the United States off-setting export cash flows, whilst pursuing aggressive domestic monetary policies to bail out it's banks (like Japan did in the 1990s).


Wednesday, June 5, 2013

Betting against Roubini

Nouriel Roubini recently came out with an article predicting gold prices to reach $1000/oz by 2015. He is not the only one being bearish. As a matter of fact, his views seem to be shared by an overwhelming majority of opinion leaders and investment banks.

For example:

Desjardins Economic Studies - target $1200
Commerzbank  - target $1227
Bank of America Merrill Lynch - target $1200
Goldman Sachs - $1270

As mentioned in a previous post, even notorious gold bulls, like Jim Rogers and Marc Faber, have mentioned $1200/oz as a possible floor for the drop in the gold price.

So, will Nouriel "I predicted the financial crisis" Roubini be correct about his gold price predictions? The arguments he is providing can be interpreted as follows:

1. The serious geopolitical risk has subsided and Gold as a "fear trade" is loosing triggers
2. Inflation has remained low in spite of massive monetary easing
3. Gold earns no income
4. Interest rates will rise (increasing the alternative cost of holding no-income assets)
5. Central banks of more indebted nations (such as Italy) may need to liquidate their gold holdings
6. Gold has been over-hyped by conservative US politicians

Just like everything else coming out of Roubini, his analysis is highly superficial, and just in line with US mainstream view (sorry Nouriel, you were not the only one, and definitely not the first one "predicting the financial crisis").

That does not necessarily mean he is wrong about his prediction, though his arguments certainly are flawed (as I will elaborate on below). Price formation for investment assets (gold, stocks or real estate) is largely determined by mainstream's expectations about future prices. If a majority of market players expect the price to go to $1200/oz, then the price will go to $1200/oz, as buyers will stop buying anticipating the price decline, and sellers will continue selling as long as the current price is above the expected future price.

As expectations are concerned, the US and European public go in tandem, with Europe usually lagging US consensus views.

What US and European public opinion leaders seem to have ignored, is that the market for gold has undergone massive structural shifts in demand over the last 12 years, dramatically changing the dynamics of the market. In q1 2013 the US accounted for a measly 4% of global gold demand, and Europe for only 6%. China accounted for a whopping 33% of global gold demand, and India for 28% according to the World Gold Council, with other mostly emerging economies accounting for the rest. Furthermore, ETF demand was only 6% of total demand.

Do US commentators still think we are in the 1980s, when the US and Europe accounted for nearly 80% of global gold demand? Roubini certainly seems to think so; all of his arguments would hold true if that was the case.

But the fact still remains that with new supply of gold increasing only a few percentage points per year, the price of gold is overwhelmingly determined by Asian buyers. It is highly questionable how much they worry about US recession risk, US inflation- and interest rate expectations, and how much they listen to Ron Paul and other ultra-conservative US politicians. They are likely to be much more preoccupied with the preservation of their domestic purchasing power, local traditions, and increases in the price of gold in their domestic currencies (which, for example in Iran, has been astronomical due to hyperinflation, contributing to Turkey becoming the third largest gold buyer in q1 2013, as Iranians cannot buy directly due to the international trade embargo).

It is the Asian buyers who predominantly have driven a five-fold increase in the gold price since 2001. And they have bought more gold because they could afford to do so. For example, average dollar wages in China doubled from 2008 to 2013. And official inflation numbers in India averaged nearly 10%, unofficially estimated by some to be at least 5% points above that. As the informed reader will know, the gold price doubled over the same period. With the recent price decline, gold has never been cheaper for the Chinese and Indian public as measured by how much gold they are able to buy. Get it? The implication of this is so important that I will repeat it: For more than 2 BILLION PEOPLE, the price of gold is at an ALL TIME LOW!

And, unless prices resume their ascent, gold will become cheaper still. McKinsey and the Boston Consulting Group have both published reports projecting Chinese wages to reach close to $20,000 by 2030.

In the near term, with central banks in the US, Europe and Japan printing money like mad to stimulate their economies in response to economic declines primarily caused by increased competition from the emerging world, domestic spending and consumption is set to increase. This is likely to result in even more imports from Asia, further fueling wages in export oriented economies.

And the gold price? Once the sell-offs by the American and European public have subsided (perhaps in a few more months), gold will resume its long term surge. At end of this blog, I allow myself to express how thankful I am for the contributions of Roubini and other egocentric imbeciles addicted to media attention (Henry Blodget of CNBC - a big thank you to you as well!). They are helping to create a major sell-off in gold when the fundamentals for owning gold are the best in 30 years. Thank you. Thank you. Thank you.

Sunday, May 19, 2013

No inflation yet? Wait and see.....

For those disappointed about the continued absence of substantial US price inflation, it is beneficial to recap a little bit of Economics 101.

Below is one a classic piece of economic analysis, courtesy of Wikipedia.com. It is called the Philips curve, after the economist who invented it. This particular chart is plotting the relationship between Unemployment and Inflation (a proxy for the latter is Rate of Change of Money Wage Rates), for the United Kingdom every year between 1913 - 1948.
File:Phillips curve.jpg
In short, the Philips curve states that high unemployment in an economy corresponds with low inflation, and vice versa. There has since Philips published his work been numerous refinements of the theory surrounding the Philips curve, however, there seem to be broad agreement on the key principles behind it.

Simply put: When general unemployment is above what economists define as the equilibrium unemployment rate, wage growth tends to slow, as the unemployed are competing for jobs. When unemployment is below, jobs are competing for the unemployed, bidding up wages. 

What the equilibrium unemployment rate is for an economy is dependent on a range of different factors. Unemployment benefits, minimum wages, laws that regulate hiring/firing, general ease/difficulty of doing business, quality of labor in a work-force etc, are general factors influencing supply and demand for labor. Generally, the more efficient/ the less restricted the labor market is, the lower is the equilibrium unemployment rate. Labor market rigidities explain why for example Spain was experiencing material wage inflation when it had 10% unemployment, while similar unemployment rates in the US on average led to declining wages.

Several analysts have estimated the US equilibrium unemployment rate to be north of 6%. This is up from its long term average between 4-5%, and reflects that long-term unemployment in the US have left more people less employable.

Currently, the US unemployment rate is 7.4%. This is still well above 6%. Hence, there is still higher supply of deplorable labor than there is demand, and on average no sign of inflationary pressure in wages.

As Uncle Ben Bernanke has promised us that he will keep printing money until US unemployment reaches 6%, he will not stop until he creates inflation. At the going speed of unemployed being hired, this point should be reached in about 12 months time.