Search This Blog

Showing posts with label Apple. Show all posts

Thursday, January 16, 2014

Model portfolio up 51% annualized, 62% since initiation


Happy new year everyone! 2014 is here, with new opportunities and new challenges.

We are entering into the new year with a booming economy in the Unites States and Japan, with Europe slowly reemerging from recession, and China tagging along its new trend growth (e.g. around 7% p.a.).

The picture is mixed in other BRICs countries, with India experiencing slower growth as a result of bad government policies, and Brazil suffering from higher US interest rates. Though higher, interest rates are still record low in a historic context, making no doubts about the role of credit financed investment once again becoming the key driver of growth.

Before making bold predictions about future investment opportunities, it makes sense to reconcile past predictions. There is no better place to start than with past expectations that resulted in money being placed, underlining the conviction behind the predictions made. Hence, I start the first blog of the new year with a review of the Model Portfolio.

The Model Portfolio is up 62% since November 2012. As it was initiated only a bit more than a year ago, annualized returns to date are 51%.

Portfolio assets were selected with the objective to minimize the risk of overall market fluctuations ("systemic risk") and only take specific positions in assets with opposite reactions to the same underlying macroeconomic driver (e.g. negative correlation). In order words, the portfolio was designed to do well independently of whether the overall stock market went up or down. A long position is Google was balanced against a short position in Apple. And a long position in Bank of America was partially off-set with a long position in gold (US recovery is positive for BAC, but negative for gold).

Common to all positions was a belief in increased liquidity in financial markets, eventually driving global inflation. As the first step in an inflationary cycle is asset inflation, the expectation has been met by surging asset values in nearly all global markets, across nearly all asset classes (commodities still being the general exception).

In spite of massive monetary stimuli by all major global central banks, inflation has still not reached Consumer Price Indexes, and has therefore still not reached the point of distorting prices, thus leading to economic inefficiencies.

Several reasons have been offered for why this has not happened yet. Behavioural economist have been pointing out that the debt loving baby boomer generation has been retiring in the US, with younger generations having a more prudent view on debt financed spending. Others have pointed out that the credit worthiness of millions of Americans has been impaired during the financial crisis, thus making them less able to borrow.

I think the explanation is much much simpler than that. In my view, there is one factor alone that overwhelmingly explains why inflation today is not double digit: The capital reserve requirement for banks has increased dramatically in the aftermath of the financial crisis.

In 2008, average banking Tier 1 capital requirements were only about 4-5% of total assets. As this implied banks could lend 20 dollars for each dollar of reserves, every new dollar created by the central bank implied 20 new dollars in circulation. Today, average banking Tier 1 reserve ratios are above 15%. That means every new dollar created is only equivalent to less than 7 new dollars in circulation.

If banks had gone from 5% to 15% capital reserve requirements without the central bank increasing the money supply, simple math suggests the affected economies would have experienced a deflation of nearly 70% (equivalent to the reduction in credit and money in circulation). Interestingly, the increase in the monetary base has been very near this figure. So central banks have been able to pull through the miracle of financing increased government spending with new money without causing inflation.

A second relevant, more intermediate factor, is that since price increases are caused by more money in circulation chasing the same amount of resources, inflation will not materialize as long as there is surplus supply of a resource at the given price level.

In the market for labour, this is illustrated by the Phillips Curve (see a previous post), which simply states that inflation will not materialize as long as unemployment is above a certain level. Philips called this the "equilibrium unemployment rate". Below this level, for the US recently estimated to be around 6%, competition for labour will push up wages, creating more demand from consumers, driving up general prices.

Hence, for inflation to materialize, the global economy must first face an economic boom, were unemployment first reaches record lows. Then wages will increase. Unless interest rates then rise to slow the economy down, wage increases will continue to drive increased demand, re-inforcing the boom, eventually causing commodity prices to increase, causing inflation to escalate.

Since the debt levels today are still very high in the economy, the central bank is likely not to raise interest rates before inflation has run its course for several years. If too high inflation goes on for too long, it will cause allocation of resources to unproductive sectors of the economy, making the recession extremely painful once the central bank eventually decides to apply the brakes (like Paul Volcker did in 1981). An extreme case of a recession following a period of high inflation also  happened in Germany in the 1930s, eventually creating a political sentiment supportive of Adolf Hitler coming to power.

OK, now this post is becoming much longer than I had intended. So let me get to what the expectations are for the Model Portfolio.

I am convinced that we are now in the very early phases of what will eventually become an inflationary boom. The reasons for this is that capital requirements of banks are unlikely to increase further, so the sterilizing impact this has had on money in circulation is unlikely to continue. Meanwhile, the FEB, ECB, BoJ, Bank of China, all of them have continued issuing new money at almost the same speed.

This should continue to lift the Model Portfolio higher, with the exception that gold will only start moving AFTER the other positions have flattened out their surge.

With unemployment in the US currently at 6.7%, it is likely to reach below 6% sometime during the second quarter of 2014. Inflation should materialize in paralell around that time, but will not escalate to problematic levels until unemployment goes down to around 5%.

When that happens (most likely in q3 or q4 of 2014), gold will be back in play. Meanwhile, there will be investment opportunities in markets that are still undergoing asset deflation (e.g. Spain, Greece, Italy). Stabilization of these economies imply they will be de-risked, and wage levels once again will become competitive, as the rest of the world will experience inflation.

Happy investing 2014!


Wednesday, May 15, 2013

Portfolio up 40%. Some reflections.

My model portfolio has in this moment an implied return of 40% since its initiation in November (see below).  Which, I presume, is quite good by any benchmark.


The position which continues to disappoint in the model portfolio, is long gold. After having reached an intra-day low of $ 1321/oz on April 16th, only to rebound to reach intra-day prices of $1490/oz around May 3rd, it has now broken through the bottom of its 4 week trading range, signalling further short-term decline. Chartists will probably start seeing "head-shoulder" formations if the price reaches 1350 (which I expect it to do), creating further self-fulling expectations about price declines.

Furthermore, price declines now seem to be expected even among the most stubborn gold bulls, which have a history of impacting the buyers sentiment (Marc Faber has become more quiet after his predicted stock market crash did not materialize in April, and after he proclaimed gold was a good buy at 1600, only to see it becoming an even better buy at $1400/oz a few weeks later, Jim Rogers, recently proclaimed he has buy orders on gold all the way down to the $1100/oz mark. Previously, before the decline, he advocated $1200/oz as a possible floor).

Support from physical gold buyers is unlikely to show the same strength around a second dip, at least not retail demand. To use myself as an example, I was among those that took the opportunity to load up on physical metal right after the floor bottomed out in mid-April (my entry point was $1380/oz, to be exact). Now, I have less cash to deploy when a similar opportunity comes along again, and need even lower prices to engage. A similar rush to buy, with the $1400/oz mark in fresh memory of physical gold buyers, is unlikely to materialize unless gold falls to around $1250/oz.

Paradoxically, the fundamentals for owning gold have not been as good as they are now for as far as I can remember. South African cash cost for gold production is around the $1400/oz mark (with China, US other producers ranging between $900-1300/oz). Should the gold price fall to the $1250/oz mark, many of these will be in a lot of financial pain, impacting market expectations about supply, and thus both the sentiment of buyers and sellers. Not to forget (if at all possible) that all the major central banks in the world seem engaged in a competition about who can add most to their currency supply.

The long-ago expected (but still missing) trigger to revive the secular bull market in gold would be signs of inflation finally materializing in the US (as other economies experiencing substantial inflation, China, India, and Iran, who is buying via Turkey, have been the key buyers of gold).

With US un-employment still hoovering north of 7.4%, general inflation, as measured by the CPI, is unlikely to materialize at least for another 12 months, and will be subsequent to statistics showing sizable development in credit expansion, and increases in the velocity of money. Until this point is reached, the gold price is likely to go sideways, my guess is with a solid floor around $1150/oz, $1400 to form the upper range of the band.

Monday, April 8, 2013

Chinese Wage Inflation Will Eat Apple's Margins

Apple's (AAPL) Baseline Scenario is Negative Growth

Apple stock has had turbulent fall from it's all time high of $700 per share in September 2012. The share price has continued its decline throughout the first quarter of 2013, in spite of the company announcing record profits in January for q4 2012.

Apple is now valued at a trailing P/E multiple of just 7, when adjusting for the net cash position. A simple approach to valuing the company, using a Gordon Growth formula on 2012 Free Cash Flow ($ 41 billion) suggests that in order to justify the current valuation levels, growth must be 5% negative per year to eternity.

If you are familiar with this approach, skip to the next section of this article. If you have no idea what I am talking about, read on.

Using the Gordon Growth Formula to value equity on equity cash flows assumes that

V = FCF*(1+g) /(Ke - g)

where V is the current value of future cash flows to equity adjusted for current cash position, FCF is the current Free Cash Flow to equity, Ke is the cost of equity, and g the expected growth rate.
Solving for g yields (using rounded numbers for Ke, V, g)

g = ((V * Ke) - FCF/ (V + FCF) = (($300Bn * 8%) - $41Bn)/ ($300Bn + $41Bn) = - 5%

Assuming an expected inflation rate of 2.5%, this is a 7.5% real decline per year.

Both Increased Competition And Increased Production Cost Is A Superbearish Cocktail

In spite of annualized sales being up 18% year on year in the forth quarter of 2012, earnings per share have decreased (-0.5%), mainly due to gross margin erosion (38.6% vs. 44.7% just one year ago).

Corporate guidance is suggesting both lower sales and lower margin for the 2nd quarter of 2013, corresponding to about $ 9.3 billion in net profits (mid-range of guidance), which is a decline of roughly 30% on q2 2012.

Apple has a history of under-promising and over-delivering. Though this is a lot easier to do when things are going well, management guidance probably has a buffer baked into the numbers, which are due in the last weeks of April. Though certain analysts (Citygroup, Jeffries) are highlighting there is significant risk that Apple will come short of its own bearish guidance, it may be reasonable to expect actual earnings to be around 5% above corporate guidance.

However, it is without a doubt that in addition to sales cannibalization from Android devices, Windows equipped Nokia (NOK), and a revamped BlackBerry (BBRY) hand-set, continued margin erosion is inevitable.

The three most important factors driving the margin erosion are:

1. A shift in product mix towards lower margin products (the iPad mini, budget iPhone rumored to be due in June)
2. Expansion of sales in more price sensitive emerging markets, where Apple is lagging Samsung (EWY) and Nokia in sales and distribution
3. Higher production cost in China due to wage inflation

Of these three factors, the third is the most ignored and underestimated, and most difficult to control and predict for Apple management.

A Closer Look at Chinese Wage Inflation

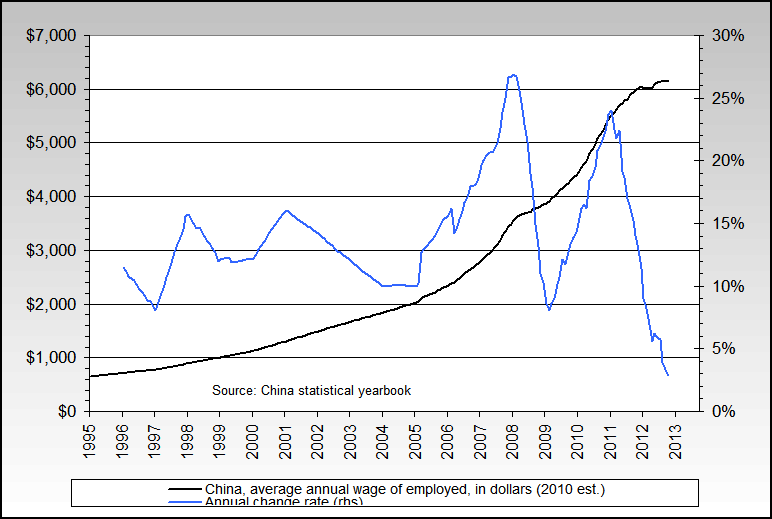
Chinese real wages have almost doubled since 2008 (see below chart, courtesy of Itulip.com). This as a direct consequence of the aggressive quantitative easing policy undertaken by the US Federal Reserve, a gigantic (though now decreasing) US current account deficit vs. China, and the Chinese policy of keeping the yuan in a narrow trading range against the USD.


As QE3 is continuing, so will Chinese wage inflation. Foxconn, that manufacturers iPad, iPhone and iPod has over 1.2 million workers in China and is periodically experiencing workers unrest due to demands for higher pay. Earlier this year, reports emerged that Foxconn had halted new hiring at its factories in China.

It it worth noting that Foxconn reported record earnings for the 4th quarter of 2012, at $1.21 billion, a 5.6% increase on the previous year, but also that the increase came at the expense of a minor decrease of it's net profit margin (from 3.24% to 3.23%).

Moving Production to Other Low Cost Geographies Will Take Time And Effort

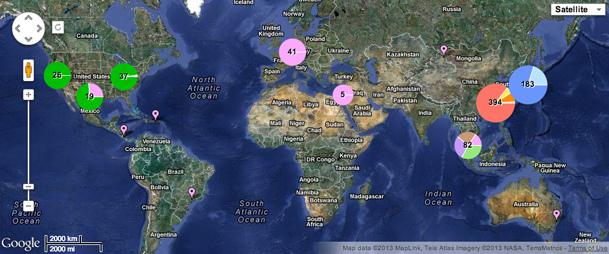
Among the company's top 800 suppliers, almost 400 are in China (below distribution of Apple's suppliers, courtesy of Chinafile.com)


As Foxconn operates global production facilities, a shift in production over time to lower cost geographies is likely to be expected.

Bank of America Merrill Lynch this week estimated that Mexico's labor costs are now 19.6 percent lower than China's. Foxconn has existing operations in Chihuahua City, Guadalajara, Reynosa and Tijuana, which can be used as base locations also to produce Apple products.

Though it is possible for Apple to shift production over time to other locations, it is a painfully slow process due to the sheer size of local operations and the complexity of the supply-chain. Besides keeping tight control on the quality of work and components (which requires extensive training of suppliers), a key requirement of the Apple supply chain is to make new products quickly enough after launch to meet consumer demand.

Chinese wage inflation will eat Apple's margins, for many years to come.

Saturday, March 30, 2013

Portfolio up 30% since November


My position in BAC, GOOG and AAPL are moving in the right direction, though gold keeps under-performing (will probably not see any positive movement here until mid-2014).

Monday, February 18, 2013

Appropriate asset strategies for inflation

What assets will appreciate faster than inflation in a high-inflation environment?  

Certainly not stocks. Before inflation materializes, yes, but not when inflation has materialized. Inflation creates information inefficiencies, as corporate accounts become in-transparent, and it becomes very hard to see which company is profitable or not. Furthermore, due to high variability in prices, financial and operational planning becomes more difficult, tending to suppress investments. The real tax burden on companies increases, as profits become artificially inflated by timing differences. Finally, inflation will drive up interest rates, increasing the cost of capital for companies, making profits less valuable. In the inflationary period starting in the late 1960s (when Nixon was printing money to pay for Vietnam) the stock market was nearly flat until 1982 (though volatility was high), and corporate earnings increased less than inflation (average P/E multiples on the S&P 500 where in the range of 6-8).

Certainly not real estate. Cost of financing will increase, driving up required real estate yields and driving down valuations. As rents are adjusted with a time-lag, income from real estate asset will lag inflation. At current valuations (which in spite of the decline since 2008) house prices are still high in a historical context. Real estate will be worse investments than common stocks when it comes to preserving wealth. In the period up to when inflation materializes and interest cost adjust (which is what is happening now, foreseen to continue for at least 18 months) real estate will provide superior returns, but will be punished with a vengeance later on in the cycle. Back in 1978, my father paid for his first one-bed-room apartment with an amount corresponding to 6 month salary (and he was an entry level manager at the time).

And (for the sake of completeness) certainly not bonds or T-bills. If you among the few who might wonder why, google the term "bond duration" and you will know.

So, what is left then? Commodities? Farmland? Treasury Inflation Protected Securities???

Jim Rogers is a fan of the first two. His thesis is that purchasing power will increase more in Asia, leading to Asians eating more meat, which will push up the price of grain and increase yield on land. And there is some truth to it. Commodities performed relatively well during the high-inflationary period of 1968-1982, only to get hammered in the 30 years thereafter.

Treasury Inflation Protected Securities (TIPS) may provide some support, as the existing ones will be bid-up, as their (already very low) yields are likely to become even lower.

The key to survival in a high inflationary environment lies in capital allocation decisions. The optimal strategy is:

1. Purchase real estate with low maintenance and running cost, leverage your purchase to the max, and fix the interest rate for as long as you can. This is an asset that you can live in, and if you have a wood-fired oven to keep you warm, you can always manage variable costs....

2. Allocate a percentage of your remaining portfolio to precious metals (suggest 35%). A lot of people out there are very bullish on silver due to a favorable supply/ demand situation (usage in electronics keeps increasing, but supply from silver mines keeps experiencing larger and larger production cost). Also, in the extreme case of a hyper-inflation environment, where precious metals take over as currency (yes Armageddonists, you will love this!), Silver is more practical than gold, as coins can be used for everyday purchases due to lower value. Silver, however, has higher transaction cost when you want to buy and sell it and requires more storage. I prefer gold to silver, though gold has been very overbought and mid-term price direction is uncertain.

3. Allocate a percentage of your remaining portfolio to shorting US treasuries with long duration (suggest 20%). There is huge upside in such as position, as bond values converge to zero, you will at least double your money. Just remember to keep re-investing proceeds, to maintain the same exposure all the time (doubling the nominal value of your cash might not be enough to give you inflation protection).

4. Allocate a percentage of your remaining portfolio to financial service stocks (suggest 40%), especially financial brokers arranging ETFs, those that have proprietary trading activities in equities and commodities, and do NOT have bond market making activities. Money will pour into commodities, ETFs for all kinds of real assets, in a rather headless fashion, and investment and commercial banks will skim the margins. The size of their balance sheets, equity under management etc should increase with the rate of inflation, and inflation will reduce impairment risk of assets. When inflation is killed (no risk of this next 5-8 years though) banks will be in a pile of pooh-pooh, as they will have allocated a lot of capital to intrinsically unprofitable investments. However, whoever comes after Helikopter Ben needs to have a plan no cause a collapse, and warning signs will be ample.

5. Producers of farmland equipment can also be a good play for the next 5 years. Large-cap farming equipment producers with low P/E ratios have the potential to be re-priced as growth stocks when the market overshoots. And there will be acquisition plays as larger producers swallow the smaller ones with borrowed money.


Sunday, January 6, 2013

Portfolio up nearly 20% so far....


The only loss making position is a long-term position in gold, which probably will not resume its growth path until late 2014 as it has been overbought, in spite of favorable underlying economic fundamentals.

Sunday, November 11, 2012

Portfolio allocations

Time to put money where the mouth is.

Today it is November 11, 2012 and here are some indicators on the economic health of the world, how they will be affected the next 2-3 years by the ongoing QE 3 and why. 

Apple stock: USD 547 per share. Short, 50% of capital at risk.
Google stock: USD 663 per share. Long, 50% of capital at risk (balancing Apple short position).

Bank of America stock: USD 9.43 per share. Long, 50% of capital at risk.
Physical gold: USD 1735/ ounce. Long, 50% of capital at risk.

Note that the total sum of the portfolio weights are 100%.

Rationale

Apple: Inflation will increase production cost faster than Apple can raise prices, putting pressure on margins. Also, Apple's applications are becoming commoditized by competition and iOS will never (ever) evolve to become the industry standard (such as Windows has been for PC) as Apple is making the mistake of limiting it to own devices only.

Google: The company is service based (excluding Motorola) and can thus easily adjust prices to match its cost base in a high inflation scenario. From a fundamental point of view, the company is well positioned to gain exposure to fast growing service segments such as iCloud services and is in the position to cannibalize the business models of Facebook, Linked-in, PayPal, Skype and Amazon, through interaction/cross sell to its Gmail user base (the largest/ most popular web-based e-mail application in the world). Further spread of the Android operating system (penetrating increasingly cheaper devices and alternative applications, such as TVs, MP3 players, car stereos, digital watches etc) will provide additional channels for its advertising business and boost income from the Google Play store. It also has proven to have the ability to compete in the hardware segment through clever partnering - Nexus 7 and Nexus 4 are currently the best value for money buys within 7' tablets and 4' smartphones, respectively.

Bank of America: A bank is a service intermediary. It can easily mitigate higher costs (e.g. borrowing interest rates) by raising prices (lending interest rates). It is sensitive to opex increases due to high cost/income ratio, but in a high inflation scenario, salaries will grow slower than income as most of the inflationary pressure is created outside the domestic economy through commodity price increases. The banks balance sheet will increase faster than the money supply, as the velocity of money picks up when consumers start borrowing again, expecting further prices increases in real assets. Furthermore, BoA is one of the largest banks in America, and size matters in banking, due to huge synergies in the utilization of IT systems, diversification of risk and corresponding lower funding cost. Bank of America is trading at a Price to Book ratio of around 0.45. A fairly valued large bank should be trading around 1.2-1.5.

Physical gold: QE 3 is primarily creating inflation in countries that have pegged their currencies to the USD, and only secondary in the US, due to continued surplus supply in the labor market (8% unemployment is still above the 5-7% equilibrium unemployment rate). Some of these countries (India and China in particular, together with more than 40% of global gold demand) have long traditions for saving in gold. As incomes continue to increase in China, India, Brazil, SE Asia, etc, so will the long-term demand for gold in these countries.